核心提示:leaflat 创建地图的例子。代码如下:!DOCTYPE htmlhtmlheadtitleleaflet/titlemeta charset=utf-8link rel=stylesheet hr...
leaflat 创建地图的例子。

代码如下:
<!DOCTYPE html>
<html>
<head>
<title>leaflet</title>
<meta charset="utf-8">
<link rel="stylesheet" href="https://unpkg.com/leaflet@1.2.0/dist/leaflet.css">
<script src="https://unpkg.com/leaflet@1.2.0/dist/leaflet.js"></script>
<script src="https://libs.baidu.com/jquery/1.7.2/jquery.min.js"></script>
<style TYPE="text/css">
body {
margin: 0px;
padding: 0px;
}
/**
* 单独设置mapid为100%不显示,可能float坍塌
*/
html,
body,
#mapDiv {
height: 100%;
width: 100%;
}
</style>
<script>
$(function() {
//实例化对象
var map = L.map('mapDiv');
//设置地图视图(地理中心和缩放)
map.setView([35, 104], 5);
//地图地址
var url = 'https://api.tiles.mapbox.com/v4/{id}/{z}/{x}/{y}.png###access_token=pk.eyJ1IjoibWFwYm94IiwiYSI6ImNpejY4NXVycTA2emYycXBndHRqcmZ3N3gifQ.rJcFIG214AriISLbB6B5aw';
var attr = ' Map data © <a href="https://www.openstreetmap.org/copyright">OpenStreetMap</a> contributors, © <a href="https://cartodb.com/attributions">CartoDB</a>';
//图层
L.tileLayer(url, {
maxZoom: 18,
attribution: attr,
id: 'mapbox.streets'
}).addTo(map);
//圆心
var circle = L.circle([39.921108, 116.395562], {
color: 'red', //边框颜色
fillColor: '#f03', //填充颜色
fillOpacity: 0.2, //透明度
radius: 200000 //半径 米
}).addTo(map);
//多边形
var polygon = L.polygon([
[31.844248, 117.232868],
[30.586032, 114.32653],
[28.235398, 112.956396]
]).addTo(map);
//标记点
var marker = L.marker([45.761159, 126.595657]);
marker.bindPopup("<b>哈尔滨</b>");
marker.addTo(map);
L.marker([39.921108, 116.395562]).addTo(map).bindPopup("<b>北京!</b><br />直辖市.");
L.marker([39.120097, 117.206074]).addTo(map).bindPopup("<b>天津市!</b><br />直辖市.");
L.marker([31.233953, 121.460992]).addTo(map).bindPopup("<b>上海市!</b><br />直辖市.");
L.marker([29.573519, 106.545211]).addTo(map).bindPopup("<b>重庆市!</b><br />直辖市.");
//可拖拽的标识
var marker = L.marker([30, 118], {
draggable: true, // 使图标可拖拽
title: 'Text', // 添加一个标题
opacity: 0.5 // 设置透明度
})
.addTo(map)
.bindPopup("<b>中国</b><br>安徽黄山.")
.openPopup();
//图标
var shadowUrl = "https://leafletjs.com/examples/custom-icons/leaf-shadow.png";
var orangeUrl = "https://leafletjs.com/examples/custom-icons/leaf-orange.png";
var redUrl = "https://leafletjs.com/examples/custom-icons/leaf-red.png";
var greenUrl = "https://leafletjs.com/examples/custom-icons/leaf-green.png";
//配置图标选项
var LeafIcon = L.Icon.extend({
options: {
shadowUrl: shadowUrl, //阴影图像
iconSize: [38, 95], //图标的大小
shadowSize: [50, 64], //阴影的大小
iconAnchor: [22, 94], //点图标将对应标记的位置
shadowAnchor: [4, 62], //相同的影子
popupAnchor: [-3, -76] //点弹出打开相对于iconanchor
}
});
var orangeIcon = new LeafIcon({
iconUrl: orangeUrl //图标图像
});
var redIcon = new LeafIcon({
iconUrl: redUrl //图标图像
});
var greenIcon = new LeafIcon({
iconUrl: greenUrl //图标图像
});
L.marker([43.83326, 87.619841], {
icon: orangeIcon
}).addTo(map).bindPopup("<b>新疆维吾尔自治区</b>");
L.marker([22.373712, 114.16599], {
icon: redIcon
}).addTo(map).bindPopup("<b>香港特别行政区</b>");
L.marker([22.157174, 113.576772], {
icon: greenIcon
}).addTo(map).bindPopup("<b>澳门地区</b>");
//弹出面板
//绑定一个弹出标记点击并打开它
var popup = L.popup();
popup.setLatLng([37.888837, 112.557541]);
popup.setContent("<b>太原</b>");
popup.openOn(map);
var popup2 = L.popup().setLatLng([25.051612, 121.531195]).setContent("<b>台北市!</b><br />台北.").openOn(map);
//添加点击事件
function onMapClick(e) {
popup
.setLatLng(e.latlng)
.setContent("点击坐标: " + e.latlng.toString())
.openOn(map);
}
map.on('click', onMapClick);
})
</script>
</head>
<body>
<p id="mapDiv">
</p>
</body>
</html>
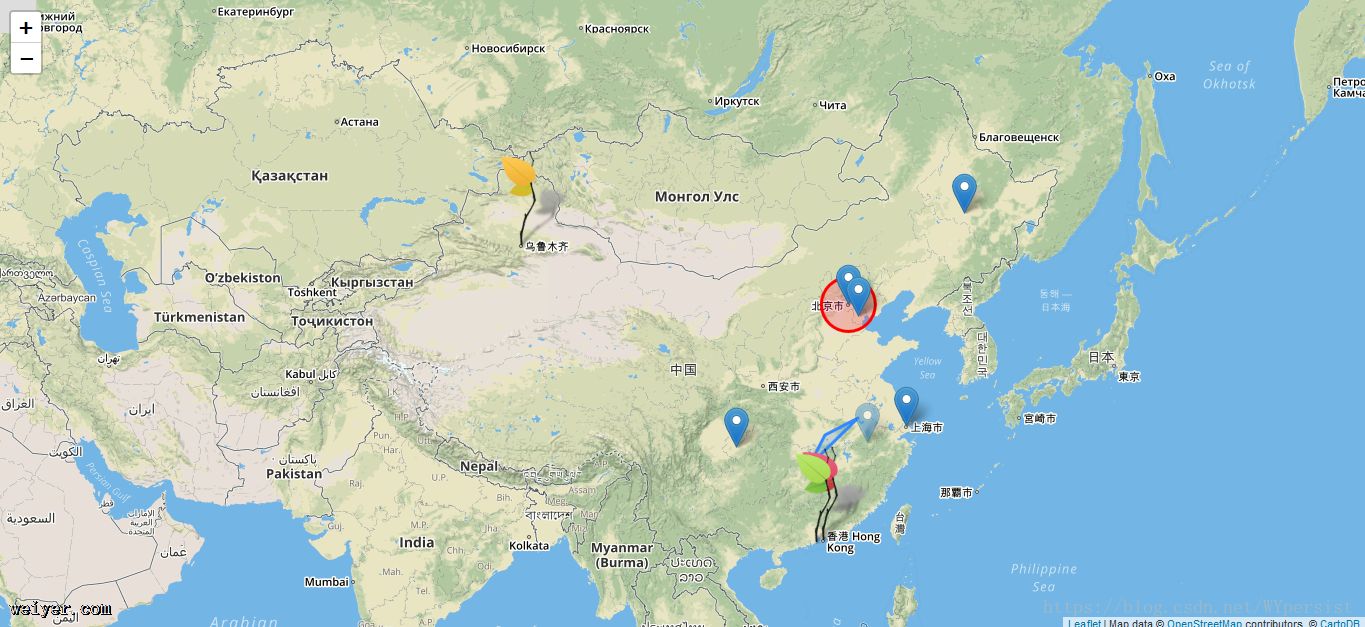
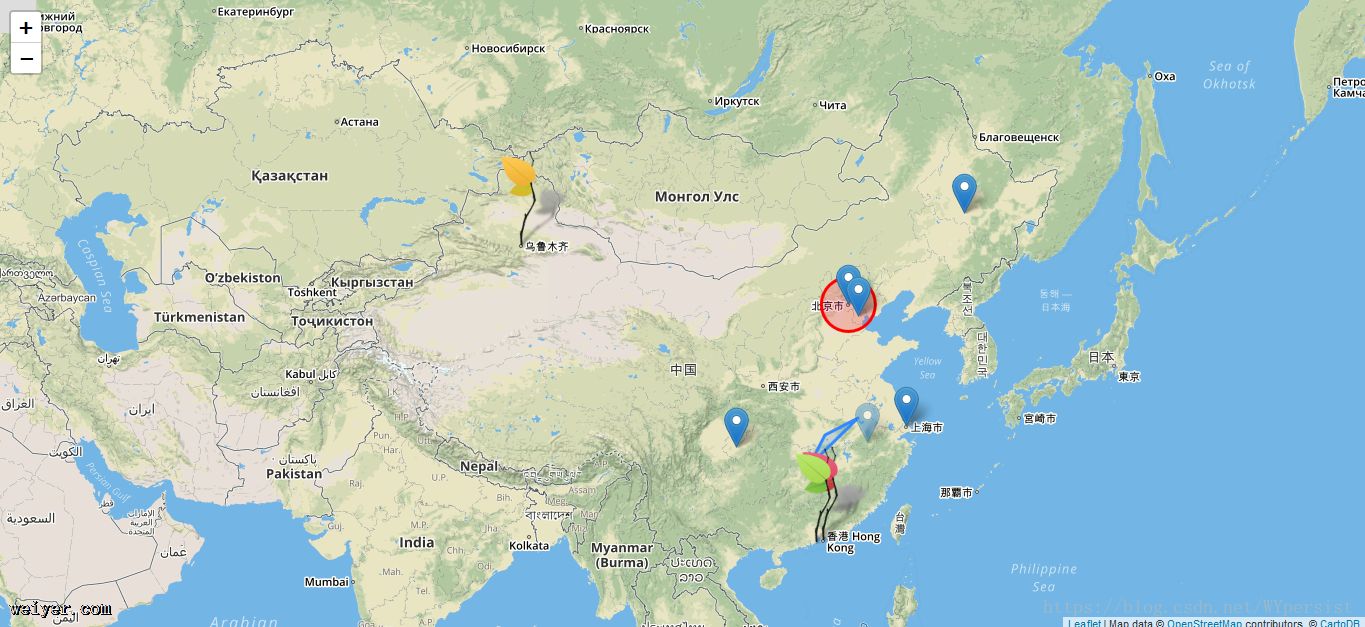
效果如下:


